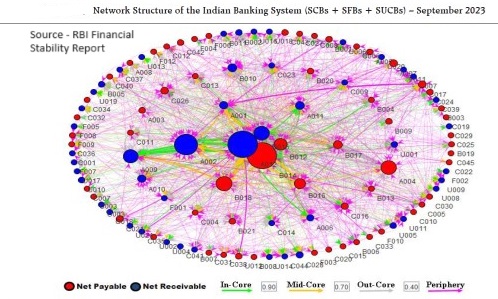
Financial structure of a country is a network of institutions such as Banks, NBFCs, HFCs, Insurance companies, mutual funds and so on. All of these are connected to each other as lenders or borrowers. While the interdependency helps channelize savings into investments, it can also trigger risk events as seen during the global financial crisis in 2008. Indian financial system also saw failures of some financial institutions in the recent past such as IL&FS, Yes Bank, PMC etc. These failures did not lead to cascading effect or systemic failure because interconnectedness of Indian financial institutions was within its risk absorbing capacity. Here is a brief look at the same based on RBI’s latest financial stability report.

The term interconnectedness in simple terms means dependency of financial institutions (FIs) on one another for funds. The dependency arises as segments such as Insurance firms (IFs) or mutual funds (MFs) receive large sum of money but do not have sufficient avenues for deployment. Hence, they lend to other financial institutions such as banks, NBFCs or HFCs (Housing Finance Companies) who, eventually, lend to private borrowers. Interconnectedness is an important parameter monitored by the regulator as it helps them identify ‘systemically’ important financial institutions, failure of which can have a cascading effect.

As per the FSR, total bilateral exposure across different entities stood at Rs 61 lakh crore, up 16% from a year ago. While the number looks huge, it is only 13% of the total assets managed by these entities. Yet, there could be higher dependence of some individual entities and RBI keeps constant watch on them through regular audit. Among the FIs, MFs, IFs and public sector banks (PSBs) are the providers of funds whereas NBFCs, private banks and HFCs are the recipients. The biggest lender group is MF industry having lent Rs 14 lakh crore (net) to other FIs at the end of Sept’23. This corresponds to a sharp increase of 33% from a year ago against 11% in the previous year, a result of significant funds inflow into MFs. (This is the net amount. Gross lending is Rs 14.8 lakh crore whereas borrowings is Rs 0.8 lakh crore which means some of the MFs are short of funds and have borrowed money). The lent amount constituted over 33% of their total corpus, higher than 30% in the previous year. In terms of their borrowers, SCBs (scheduled commercial banks) are the largest accounting for nearly 60% whereas NBFCs received 20%.

IFs (insurance) is the other funds surplus segment providing Rs 8.2 lakh crore, about 11% increase over last year. It may be noted that growth rate for IFs is not huge like MFs. Here too, SCBs (scheduled commercial banks) are the largest borrowers with 53% share and NBFCs with 30%. (A point that comes to mind is – is it possibly to give license to IFs to enter into lending business to reduce the cost of intermediation?). A difference between IFs and MFs is that the former has deployed close to 57% of their funds on long term basis against 20% by MFs. This is so because cash outflow for IFs is longer term in nature unlike MFs which are exposed to short term redemption possibilities. It may also be noted that share of long-term debt for MFs has come down sharply from 36% in Sept’20. MFs had faced severe redemption pressure in March/April’20, at the onset of Covid-19, when RBI provided them the much-needed liquidity. MFs, wiser after that experience, have reduced their exposure to longer term instrument even though that gives better return.

On the other side of the lender-borrower equation are NBFCs and SCBs who are in the core business of lending. NBFCs are the largest borrowers with borrowings of Rs 14.1 lakh crore, up 25% from a year ago. Even though NBFCs are borrowing from MFs and IFs, their biggest source of funds is SCBs, which, in turn, is mobilizing funds from MFs and IFs. SCBs provide 56% of NBFC’s total borrowings. A question arises as to why MFs and IFs are not directly lending to NBFCs but parking higher amount of funds with SCBs. This is so because it helps them transfer their risk to SCBs who have huge balance sheet size and therefore, higher risk capacity. SCBs have borrowed about Rs 12.7 lakh crore from MFs and IFs, whereas its exposure to NBFCs is Rs 6.7 lakh crore. NBFCs dependence on SCBs has also gone up from 40% in Sept’17 with drying up of funds from other sources after IL&FS fiasco. The composition of NBFCs’ borrowings has also changed significantly with share of commercial papers (CP), an unsecured from of lending, increasing from 3.4% in Sept’22 to 4.5% in Sept’23. CP’s share had fallen sharply from 13.1% in Sept’18. It appears the risk appetite of the market is returning.

HFCs is the other largest group, borrowing Rs 5.1 lakh crore. The figure is down by 28% over last year, a result of the merger of HDFC Ltd, the largest HFC, with HDFC bank. Yet, this accounts for almost half of total assets for HFCs indicating their huge dependency on other segments for funds. Even for HFC, SCBs are the biggest source of funds accounting for 55% of their borrowings with MFs’ share declining over the years. This implies higher recourse to longer-term funds which helps reduce liquidity risk. Share of CPs for HFCs also has come down from 18.4% in June’18 to 10.4% by Sept’19 and 4.6% now. Financial system also consists of UCBs (urban cooperative banks), AIFIs (All India Financial institutions), PFs (Provident funds) etc but their exposure in the market is marginal.

Apart from dealings with other FIs, banks also lend/borrow among themselves in inter-bank market. Total exposure in the inter-bank market stood at Rs 8.5 lakh crore in Sept’23, up by about 20% from a year ago. While the transaction across the financial market is largely long-term based, in inter-bank market, 70% of exposure is short-term in nature. This is largely required to meet mismatch in asset-liability. In inter-bank market, PSBs are the primary lenders whereas private banks are net borrowers. Private sector banks borrowings have increased sharply to over Rs 10 lakh crore, up almost 60% over last year. While foreign banks (FBs) have a net zero position in the inter-bank market, there share in total market is 13%. This means one set of FBs is cash surplus and lending whereas another set is cash deficit and borrowing.

As a percent of total banking assets, inter-bank market size has declined from 9.5% in March’13 to 6.2% in March’17 and 3.3% now. This means better asset-liability management across banks, lesser scramble for short-term funds and more responsible banking. It may be noted that global inter-bank exposure had crossed 20% in 2007 as per an IMF paper before the global financial crisis erupted. Sudden freezing of funds in the inter-bank market was among the causes of collapse of several banks that time.

Other than the quantitative measure, degree of interconnectedness is also measured by qualitative measure such as connectivity ratio and cluster coefficient. Connectivity ratio refers to number of linkages (lending or borrowing) among banks against total number of possible links. For instance, maximum possible link among a group of five banks would be 10. (The mathematical term, 5C2). If two of the banks have borrowed from one bank and one other bank has borrowed from two banks, then the ratio would be 4/10 or 40%.

Cluster coefficient refers to connectivity within a group of banks where one bank is dominant. This gives an indication of the vulnerability of the group as a whole. For instance, if bank A has lent to B, C & D and if B, C & D have also lent to/ borrowed from each other, then the cluster coefficient of the cluster comprising of A, B, C & D is high. This, most likely, means that one of these banks is borrowing not for its own needs but also to lend to another within the group. (For instance, bank B gets funds from Bank A up to a limit which is not sufficient for its needs. It, therefore, borrows from bank C, which, in turn, borrows from Bank A).

For Indian banking industry, connectivity ratio stands at 18.3%, same as last year but down from about 25% in March’15. This roughly means, out of a group of five banks, less than two banks have borrowed and from only one bank. (Or one bank has borrowed from two banks). As per the IMF paper, connectivity ratio across global banks had gone up to as high as 79% before 2008 crisis which means banks were borrowing not for its own need by for onward lending to gain from interest rate arbitrage. Cluster coefficient stands at 41.3%, again, same as last year. The coefficient has been largely constant in the range of 40-42% over last 5-6 years.

Note from FSR – The diagrammatic representation of the network of the banking system is that of a tiered structure, in which different banks have different degrees or levels of connectivity with others in the network. The most connected banks are in the inner-most core (at the centre of the network diagram). Banks are then placed in the mid-core, outer core and the periphery (concentric circles around the centre in the diagram), based on their level of relative connectivity. The colour coding of the links in the tiered network diagram represents borrowings from different tiers in the network (for example, the green links represent borrowings from the banks in the inner core). Each ball represents a bank and they are weighted according to their net positions vis-à-vis all other banks in the system. The lines linking each bank are weighted on the basis of outstanding exposures.

Leave a Reply

Your email address will not be published. Required fields are marked *

error: Content is protected !!